Understanding how tides and currents impact the navigation of a sailboat is important when charting your course. Being able to make the proper course corrections based on the available tidal and current data is an important skill set every sailor should be comfortable with.
How Tides and Currents Can Affect Sailing Navigation
When we think about sailing navigation, we usually think about it basically as an amusement activity. But there is so much more to it.
It can be an entertaining and fulfilling experience, but we have to remember that sailing navigation is actually a science to travel in a controlled and safe way over water to get from one point to the other.
In order to do this, we need to learn all the necessary techniques to know our precise position compared to some reference locations and patterns.
But we are not talking here about motorboats, so besides the location, there are two more factors that we have to take into account when it comes to controlling the movement of our vessel.
Of course, these two factors are the wind on our sail and the water over which we move.
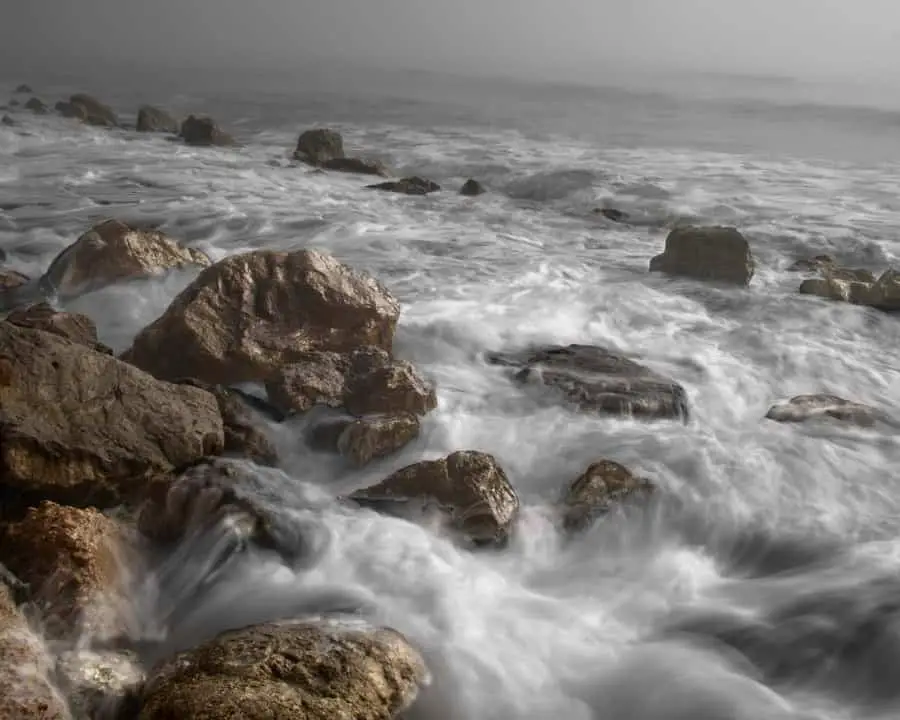
Water is in constant motion and if we don’t understand why and how it moves, we might end up having some trouble taking full control of our vessel’s movement.
So, how do we call this water movement?
Tides and currents.
What Are Tides and Currents
When we talk about the effect of water movement on our vessels, we must talk about tides and currents.
These are two different, yet related, types of movements which are caused by different factors that we need to take into account.
Tides need to be known and understood by navigators in order to move safely from point A to point B because these can have significant effects over the depth of the water and the speed of its horizontal flow.
Tides are the rise and fall of vertical sea levels caused by the combined effects of the earth’s rotation and the gravitational pull between the earth, the moon, and the sun.
Tides are the largest source of short term sea levels fluctuation, but not the only one. Barometric pressure and even winds can affect it, especially in shallow waters and coasts, where tidal waves can cause floods in a phenomenon known as tidal currents.
Currents are all the horizontal movements of water caused by tidal activity, winds, river flow, temperature, and salinity differences, among others.
A boat moving at a certain speed over still water (this is, with no current affecting it), will travel at the speed and direction over the water, while when the same boat moves over water affected by a current its speed and direction will be affected too.
Cause of Tides and Currents
Tides are the result of the differences between centrifugal forces caused by the earth’s rotation movement, and gravitational attraction forces mainly between the earth and the moon (and to a lesser extent, the gravitational attraction between the earth and the sun).
Certainly, the mass of the moon is only a tiny little fraction of that of the sun but it is also much closer to the earth and its pull is about twice as powerful. For this reason, tides are mainly a lunar phenomenon.
This gravitational pull between the earth and the moon pulls the sea surface closer to the moon causing a water bulge. As the moon rotates around the earth, the resulting bulge (wave) is carried all around the planet.
Meanwhile, on the opposite side of the earth, the moon’s gravitational pull is diminished greatly, which allows the water surface to move away from the earth causing a second, opposite bulge of water.
This is why tidal rhythms are usually synchronized with the moon’s rotation around the earth.
Because this cycle is approximately 24 hours and 50 minutes long, the high and low waters on each day, occur about 50 minutes later in the day that the same high and low tides of the previous day.
In the course of any given lunar month, the sun, the earth, and the moon are lined up twice (new moon phase and full moon phase), causing the sun’s gravitational pull lines to line up with that of the moon, which causes higher tidal stages known as spring tides.
Also in the course of any lunar month, there are two stages at which the sun and the moon form a 90angle with the earth, causing the sun to counteract some the moon’s gravitational pull over the earth and therefore, resulting in lower tidal ranges known as neap tides.
Spring tides produce higher high waters and lower low waters. Neap tides produce lower high waters and higher low waters than spring tides.
Because of the greater volumes of water that moves between high water and low water stages during spring tides, the rate of flow of the currents is also greater during spring tides.
Basic Terminology on Tides
Tides changes follow these stages:
- Sea level rises over the course of several hours. This stage is known as flood tide.
- Water rises up its highest level, this stage is called high tide.
- Sea level falls over several hours. This stage is known as the ebb tide.
- The water stops falling and reaches the stage of the low tide.
Chart Datum (CD) – Is the reference point from which all depths and drying heights are measured on a nautical chart. American charts commonly use Mean Lower Low Water (MLLW). British Admiralty metric charts use Lower Astronomical Tide (LAT).
Charted Depth – The distance below chart datum of an object or feature often referred to as soundings.
Drying Height – This is the height of an object or feature above chart datum, these features may be uncovered on low water.
Duration – This is the interval of time between successive high and low waters.
Heights of the Tide – This is the height of water above chart datum and is found by using the tide tables to find high or low water and then applying the corrections derived from the appropriate tables.
High Water – The time at which the tide reaches its maximum height. The tide tables predict the times that high and low water are expected to occur as well as the heights expected. These predictions assume normal weather conditions.
Low Water – The time at which a tide reaches its minimum height.
Lowest Astronomical Tide (LAT) – LAT is the lowest tide level that can be predicted to occur under normal meteorological conditions and so using this datum there will rarely be less water than is shown on the chart.
Mean High Water (MHW) – This is the average height of high waters for a particular place: this average is worked out over a 19 years period. This is the point from which the height of structure such as bridges and lighthouses are measured.
Mean Lower Low Water (MLLW) – The average of the lower low waters of each tidal day over a 19 years period. Used as Chart Datum on US charts. Using this datum there will often be less water than is shown in the chart.
Highest Astronomical Tide (HAT) – The highest tide which can be predicted to occur. Note that meteorological conditions may add extra height to the HAT.
Mean High Water Springs (MHWS) – The average of the two high tides on the days of spring tides.
Mean High Water Neaps (MHWN) – The average of the two high tides on the days of neap tides.
Mean Sea Level (MSL) – This is the average sea level. The MSL is constant for any location over a long period.
Mean Low Water Neaps (MLWN) – The average of the two low tides on the days of neap tides.
Mean Low Water Springs (MLWS) – The average of the two low tides on the days of spring tides.
Neap Tide – Neap tides occur about a week after spring tides and feature smaller ranges, therefore, slower flows.
Range – The difference between the height of successive high and low waters. This is found by subtracting the height of low water from the height of high water.
Reference Stations – There are usually larger ports that have their own tide tables published which contain complete tidal information with the time and height of every tide.
Springtide – Two spring tides occur every lunar month, just after the full and new moons. The spring tide features the higher high water and the lower low water, and therefore much faster tidal flows.
Subordinate Stations – There are places that do not have their own tide tables so the information has to be calculated by using the Tide Differences Table.
Rule of Twelfths – In most places where the tide has a regular cycle, there is a simple way to estimate the height of the tide.
It is very important to note that this is a very rough approximation and it will only work where the rise and fall are uniform over a six-hour period.
The rule of twelfths works on the basis that the rate of rising or fall is slow at the beginning and end of the cycle but reach a maximum at mid tide.
To reflect this, we take the range and divide it into twelfths, then say that in the first hour the tide will as follows:
- 1st hour, 1/12 of the range, 1/12 cumulative rise or fall
- 2nd hour, 2/12 of the range, 3/12 cumulative rise or fall
- 3rd hour, 3/12 of the range, 6/12 cumulative rise or fall
- 4th hour, 3/12 of the range, 9/12 cumulative rise or fall
- 5th hour, 2/12 of the range, 11/12 cumulative rise or fall
- 6th hour, 1/12 of the range, 12/12 cumulative rise or fall
Basic Terminology on Currents
Flood Stream – This usually refers to the flow of water associated with an incoming tide.
Ebb Stream – The “falling” or outgoing tide is called the EBB, so a tide may be said to be ebbing or flooding dependant upon whether it is going out or coming in.
Slack Water – Slack is the period between the flood and ebb tides when the movement of the water tails off sometimes to a complete stop before the tide turns and flows in a new direction.
Spring and Neap Rates – The speed of the currents associated with spring tides is greater than those of neaps because of the greater volume of water flowing between high and low water at springs.
Current Tables – These are published tables containing the data collected by the U.S. National Ocean Service (NOS) and the Canadian Hydrographic Service (CHS). REEDS Nautical Almanac publishes tide tables and information for the East Coast of North America.
Direction – The information about direction is always given in degrees true so can be plotted directly on the chart without correction.
Rate – The rate is the speed, given in knots, at which the current is moving. Normally two rates are given, one for springs, and one for neaps.
Tidal Current Charts – In places where the direction and rate of flow vary in a given area or is too complex to be conveyed purely in figures, a chart is often published. This can also be called a Tidal Stream Atlas.
This is actually a series of chartlets, each of which represents one hour in the life of the tidal cycle.
The direction of the current is shown with arrows, each of which will have a figure showing the associated rate. These have the advantage of showing the navigator a picture of the tide and how it is flowing.
How to Use Tidal Current Charts and Tables
The navigator needs to be able to make allowances for the current so he needs information about these currents. As with the tidal heights, this information is found in a nautical almanac like REEDS under the heading of current tables.
Current tables give the following information:
- The time of slack water.
- The time and rate of the maximum flow of the flood tide.
- The time and rate of the maximum flow of the ebb tide.
- The direction of flow of both the flood and ebb tides.
Charts and Chartwork
A responsible navigator takes any chance he has to find his position and plot it on a chart. Even if he has an electronic navigation aid at hand, it is only prudent to regularly check your position by traditional methods.
Weather conditions will dictate how often this should be done. Low visibility and bad weather are a good sign that the time between fixes should be reduced.
Expensive equipment is not required to work effectively. Your basic needs will be:
- Pencils: any type that helps you avoid scoring the chart’s surface and allows easy removal.
- Parallel rules: used to measure courses. These are not very accurate in a rolling sea or in bad weather.
- Dividers: used to measure distances in nautical miles from the latitude scale.
- Bretton type plotter: the preferred instrument. This type of plotter eliminates the need for the compass rose on the chart and is the most accurate of plotters having a correction factor of 1.
- Notebook.
- Pencil sharpener.
- Eraser.
Charts
Charts are maps of sea areas that show coastlines and prominent features, depths, objects on and under the water, and many other pieces of useful information for navigators and mariners to help them in route planning, pilotage, and navigation.
Many maritime nations have government agencies that publish charts, which are available to any interested party through the usual sources.
Scale
It indicates how much detail is shown in the chart. Large scale charts are more detailed, and these are used, for example, in harbor charts as it is needed that these can show a small area in great detail. Smaller scale charts are used to show larger areas.
Heights and Depths
The standard of measurement in the USA will be imperial rather than metric.
Depths or sounding will be given in feet or fathoms, where 1 fathom = 6 feet (1.83 m), and heights of objects will be shown in feet.
These will be marked on the title block and on the upper/lower margins, “SOUNDINGS IN FATHOMS”.
European and some other charts are likely to be metric. These will be marked on the title block and on the upper/lower margins, “SOUNDINGS IN METERS”.
Special notes, cautions, and warnings
The charts will list also certain features, dangers, and some other information is located in the area covered by the chart. The navigator must make him/herself aware of these for safety.
North/Compass rose
True North will always be at the top of the chart and South will be at the bottom.
This may vary in some strip charts and chart books. You will find the compass rose printed in several locations on the chart, with the outer ring showing true degrees ( 000to 359 and the inner ring showing magnetic degrees. In the center of the rose, the variation is noted.
Chart information
- Title and number: charts are titled and numbered according to the area covered.
- Scale
- Soundings
- Cautions: draw the attention of the user to instructions, hazards, and dangers such as restricted areas, historic wrecks, firing ranges, etc.
- Latitude: the imaginary lines which run from East to West on the earth’s surface are called Parallels of Latitude, and are graduated from 0(equator) to 90(North and South Poles)
- Longitude. the imaginary lines which run North/South from the poles are called Meridians of Longitude. Longitude is measured from East to West (0- 180 from the “Prime Meridian” which runs through the Old Royal Observatory building in Greenwich, London, England.
Be aware that you always want to read the cautions labeled on the chart before using it.
Course and Distance
The navigator must be able to express in the appropriate terms the direction to shape a Course To Steer (CTS) in order to get a vessel from one location to another, as well as obtaining a bearing from the vessel to a specific object.
A direction is measured as an angle starting at 000 (True North) and counting clockwise (through East, then South, then West, and then back to North) to 360 or 000.
The position of a vessel can be expressed in relation to a particular feature found on the chart by establishing the distance and bearing from that feature.
For example, if you were approaching Port “A” from due west, you could describe your position as being 270 from Port “A” entrance.
Time
Time is always expressed using a 24-hour clock format and not the am/pm format. This way, ambiguity is avoided. The day starts at 0000 hours (midnight) and progresses through the day to 2400 hours (midnight again).
For example, 1:00 am is expressed as 0100 (“oh one hundred”) while 1:00 pm is expressed as 1300 (“thirteen hundred”). 5:20 am is expressed as 0520 (“oh five-twenty”) while 5:20 pm is expressed as 1720 (“seventeen twenty”).
The use of the word “hours” after the numbers is incorrect, say “seventeen twenty” not “seventeen twenty hours”.
Speed
In nautical terminology speed is expressed in knots, where 1 knot is 1 nautical mile per hour, therefore you would say that the speed of a certain object is “1 knot”, not “1 knot per hour”.
The line of position (LOP): An LOP is a line somewhere on which the vessel’s position lies.
A single LOP is not enough to express a vessel’s exact position, but when plotted on a chart, it can confirm you are close toa point of danger.
Fixes
A fix is a reasonably accurate determination of your position. It requires two or more LOP, derived from simultaneous compass bearings, crossing each other to establish your position fairly accurately.
However, a fix that uses only two LOPs is less accurate than a fix made with three LOPs.